Can social media predict the next "hot" location?
I turned 400+ million rows of social media data into a Power BI tool that maps demand trends down to the census tract, and found the signals track with asking rents.
I presented this work at the ARES (American Real Estate Society) Conference in April 2022. See it with my other talks →

The idea
In real estate, evaluating a site or a new market usually means looking at rent, vacancy, net absorption, cap rates, and demographics. Those work, but they describe where a market has been. I wanted to know whether different indicators could give us more up-to-date information, or simply different insights.
The way I put it at the conference: big data turns a road map into a GPS. A road map gets you from point A to point B. A GPS adapts and finds efficiencies you didn’t see.
The data
Skanska bought social media data from Spatial.AI, drawn from sources like ESRI, UberMedia, Facebook, and Yelp. Spatial.AI tags each post to the location where it was made and groups the words people use into lifestyle labels such as Artistic Appreciation, Networking, Mindfulness & Spirituality, Pieces of History, and LGBTQ Culture. The more a label shows up in a place, the higher its score, measured against the U.S. as a whole.
What we received was raw CSV files: over 400 million rows. My job was to make that simple and easy to use.
What I built
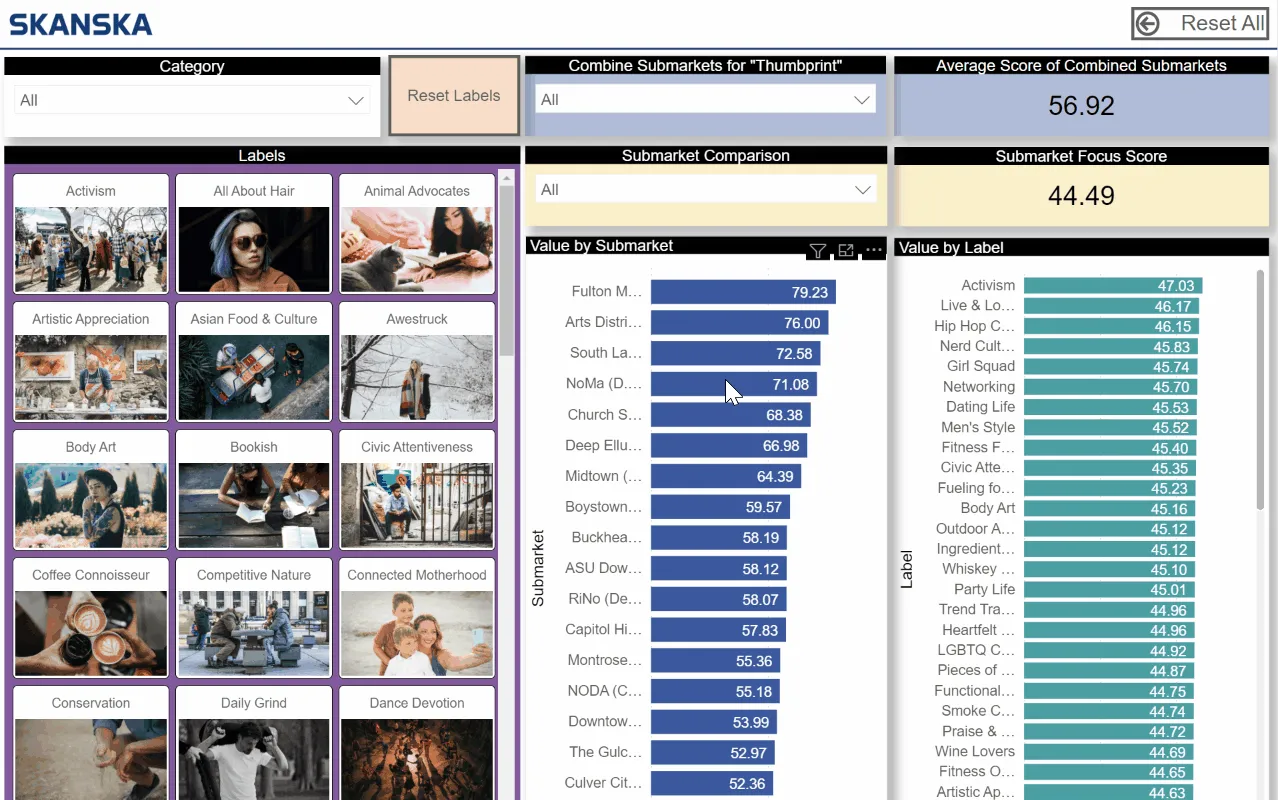
A Power BI tool anyone on the development teams could click through:
- Custom submarkets. Teams drew boundaries around the location they wanted to analyze. I mapped the census tracts inside each boundary to that custom submarket, so every analysis matched how the deal team actually thought about the area.
- Census-tract mapping. Using the Mapbox API and shapefiles, I mapped the entire U.S. by census tract. Teams could see migration patterns over time and spot the small pockets inside a submarket where activity was concentrated.
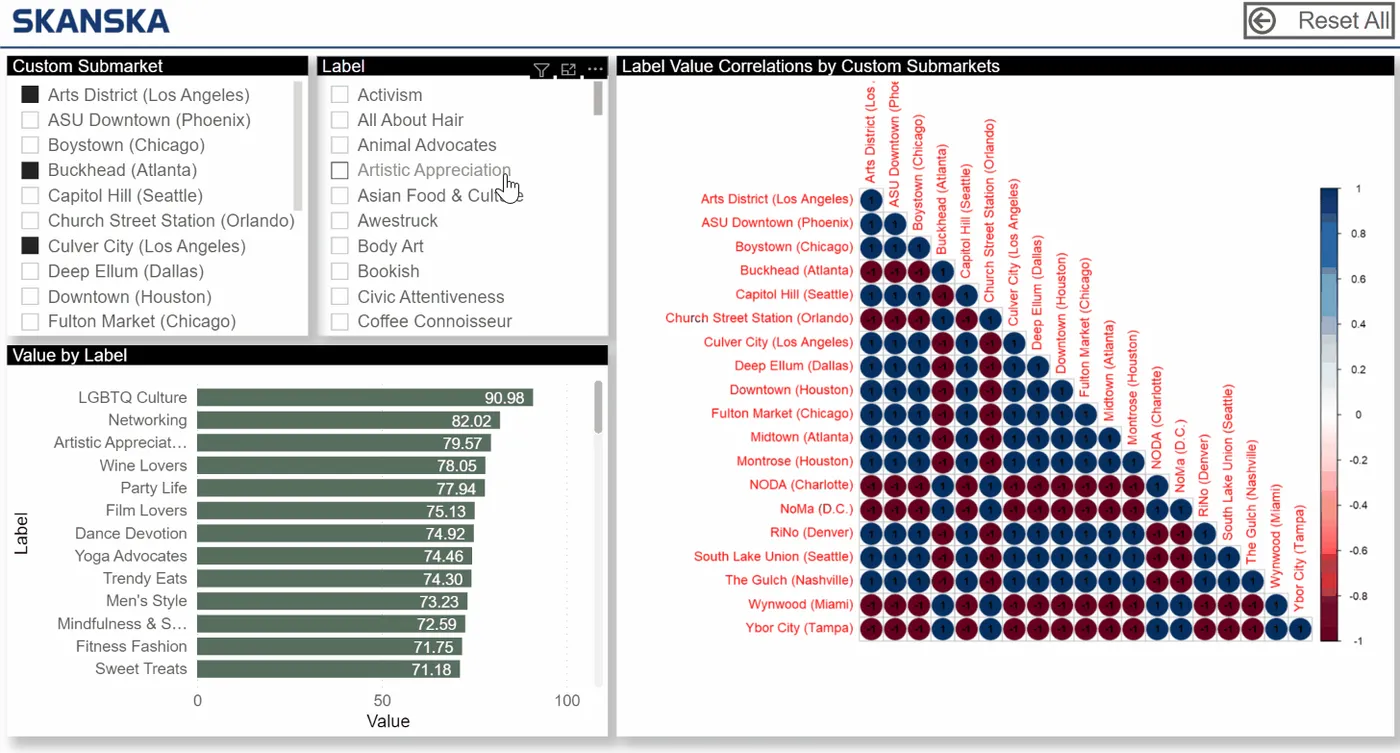
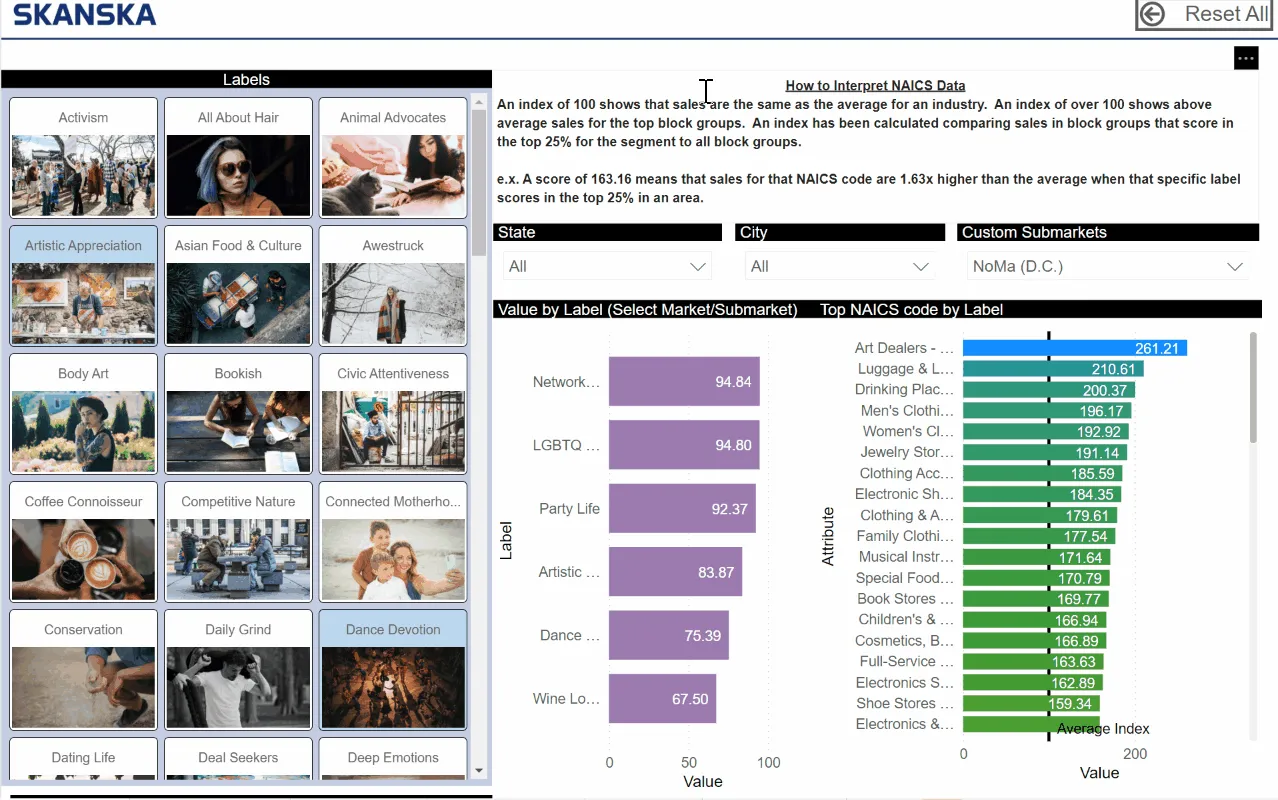
- Label-to-retail correlations. I calculated Pearson correlations between each social segment and retail sales by industry (NAICS code), applying a log transformation to the skewed sales data first. For a site’s top-scoring labels, teams could make a reasonable argument about what people there are buying.
- A correlation matrix showing how similar markets are to each other as you add or remove labels.
- Demographic profiles by label, such as median age, income, and education, to help teams tell the story of a location to the deal committee.
The finding
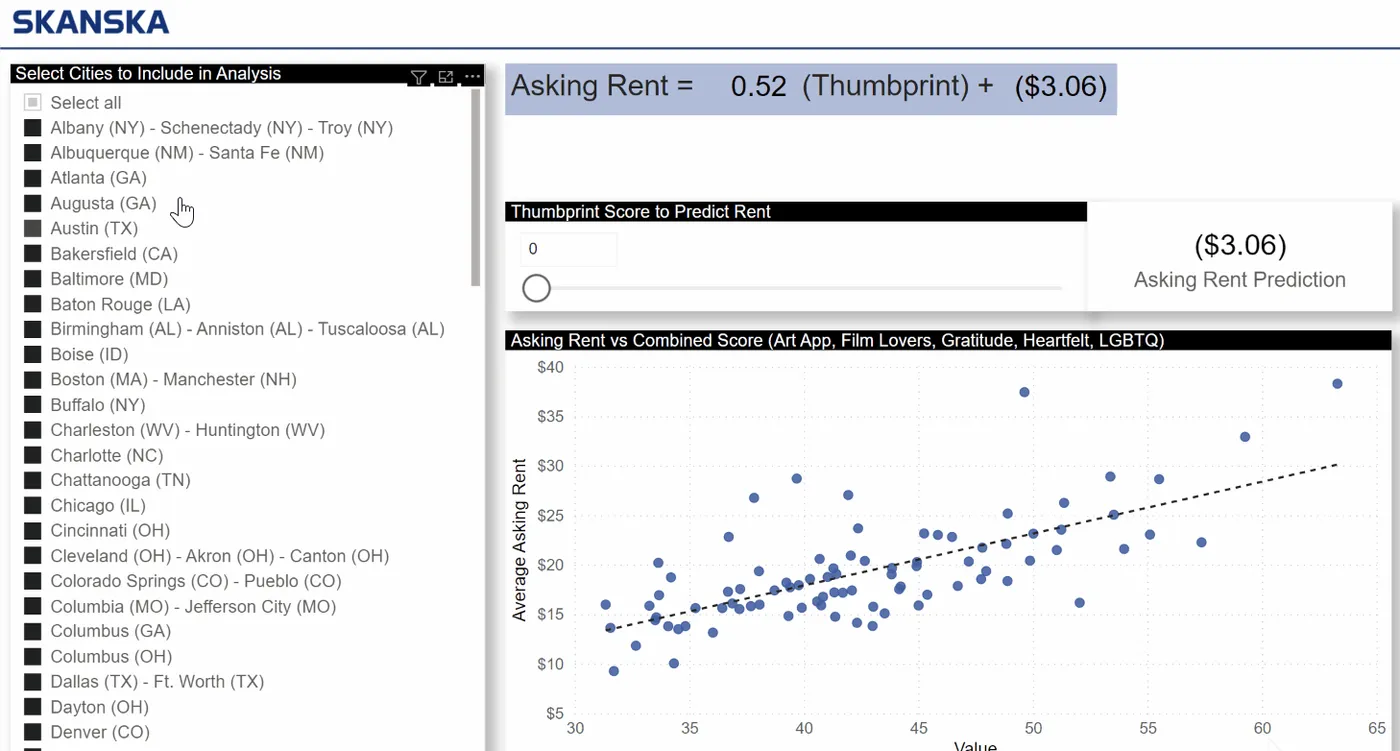
I built a combined “thumbprint” score from the labels that defined the trends in LA’s Arts District, then compared it with average asking rents across U.S. cities. As the thumbprint score rose, so did asking rents. I ran the same test against cap rates and found a similar relationship in the opposite direction.
What was next
- Tracking rent, vacancy, and net absorption against social media trends over time
- Building a custom “location score” based on the Skanska model
- Using it for site selection and for choosing which markets to expand into
Why it matters to me
This was my first big lesson in using unconventional data to support a real investment decision. It’s the same instinct I bring to AI now: find the signal nobody else is looking at, then make it simple enough that the people making decisions will actually use it.